ASSESSING THE STUDENT LEARNING
ASITHA, KODIPPILI
FAYETTEVILLE STATE UNIVERSITY
DEPT. OF MATHEMATICS AND COMPUTER SCIENCE
Dr. Kodippili Asitha Dept. of Mathematics and Computer Science Fayetteville State University, NC.
Assessing the Student Learning
Synopsis:
In this paper, we discuss the importance of the performance-based assessment as a part of assessing student learning in a Basic Probability and Statistics course. We will share our experience of creating a Collegiate Learning Assessment (CLA) style performance task and scoring rubrics to score students’papers.
Assessing the Student Learning
Using in-house designed CLA-Style Performance Task
Asitha Kodippili, Fayetteville State University
Abstract
In this paper, we discuss the importance of the performance-based assessment as a part of assessing student learning in a Basic Probability and Statistics course. We will share our experience of creating a Collegiate Learning Assessment (CLA) style performance task and instructor’s solution manual.
Introduction
Assessment is an integral part of instruction, as it determines whether or not the goals of education are being met. Assessment affects decisions about grades, instructional needs, and curriculum. Traditional assessment is the norm in most of Introductory Probability and Statistics courses. Questions that appear on traditional assessments typically test skills in isolation of a problem context and do not test whether or not students are able to integrate statistical knowledge to solve a real life problem, or are able to communicate effectively using the language of statistics (Jolliffe 1991; Garfield 1994). However, today’s students need to know not only the basic probability and statistics skills, but also skills that will allow them to face a world that is continually changing. They must be able to think critically, to analyze, and to make inferences. Therefore, it is critically important to incorporate an alternative assessment that require students to generate rather than choose a response in assessing student performance.
The Collegiate Learning Assessment (CLA) is a performance-based assessment that measures critical thinking, problem solving, scientific and quantitative reasoning, writing, and the ability to critique and make arguments. Therefore, CLA style performance task is a very suitable alternative assessment method to use together with traditional assessment to evaluate student learning in basic probability and statistics courses.
In this study, we discuss how to develop CLA-Style performance task suitable for a basic probability and statistics course and asses the value added student learning.
Literature Review
The CL!’s performance tasks were modeled after measures developed by Klein for the California bar examination (Klein and Bolus 1982; Klein 1983) and by the “Tasks in Critical Thinking” that were developed by the New Jersey Department of Higher Education (Ewell 1994; Erwin and Sebrell 2003). With this approach, tasks are derived from a domain of real-world jobs suggested by activities found in education, work, policy, and everyday practice. To perform the tasks, test-takers need to think critically and analytically about the information they are given and communicate their decisions, judgments, or recommendations clearly and with appropriate justification (see McClelland 1973). Part of the problem is for students to decide what information to use and what to ignore. Students integrate these multiple sources of information to arrive at a problem solution, decision, or recommendation.
In-house designed CLA-Style Performance Task
In this task, students are asked to assume they work as independent insurance advisors and have been requested by a client “Jeff” to recommend him the best auto insurance policy out of Liability only, Collision policy with $500 deductible per accident, Collision policy with $1000 deductible per accident based on his personal information such as the age and the type and the value of the car.
In evaluating the situation, students are given a library of information about “How Age Affects Auto Insurance Rates“, “Risk and Travel”, “What are the odds of a car crash and their severities?”
and clients information
Client Information: Age 22 Car: Honda Civic value at $10,000
Hint: The lowest cost option is the option that has the lowest sum of insurance premium plus expected cost to repair his car in case of an accident.
How Age Affects Auto Insurance Rates
By John Reed, Senior editor Association of Insurance Professionals (AIP)
Average auto insurance rate varies widely depending upon the age of the driver. When all other factors are the same or equal, older more experience drivers pay much lower auto insurance premium rates than younger drivers. In order to better illustrate how age affects auto insurance rates, here is a sampling of rates per six-month policy collected from MycarInsurance.com for a one person (male) policy with liability coverage amounts $50,000 bodily injury per person, $100,000 total bodily injury for each accident, $50,000 property damage per accident for a Honda Civic value less than 15000.
| Age Group | Average rate Liability Only | Average rate $500 Deductible | Average Rate $1000 Deductible |
|---|---|---|---|
| 16-19 | $1,300 | $1900 | $1800 |
| 20-24 | $860 | $1390 | $1310 |
| 25-29 | $830 | $1230 | $1150 |
| 30-34 | $800 | $1180 | $1100 |
| 35-39 | $790 | $1170 | $1090 |
| 40-44 | $770 | $1150 | $1070 |
| 45-49 | $750 | $1130 | $1050 |
| 50-54 | $650 | $1030 | $950 |
| 55-59 | $610 | $990 | $910 |
| 60-64 | $580 | $960 | $880 |
| 65-69 | $620 | $1000 | $920 |
| 70-74 | $580 | $960 | $880 |
| 75 and up | $605 | $985 | $905 |
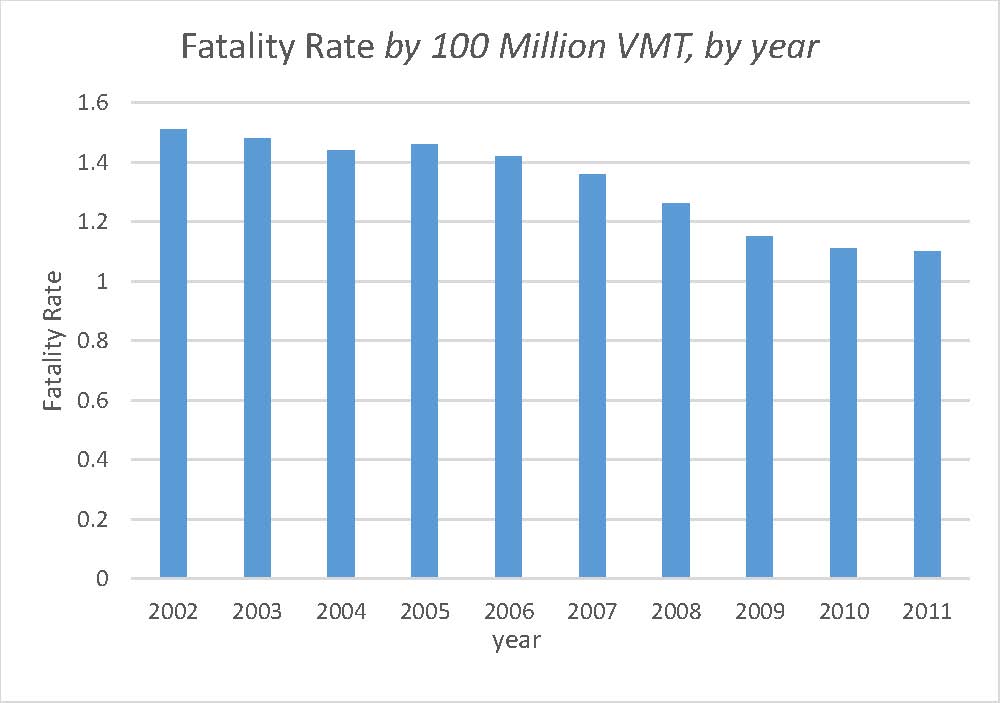
Risk and Travel
According to auto.howitworks.com, we drive safer cars on safer roads today. Travel risk is often expressed in terms of accident rate or death rates. The figure shows the automobile fatality rates per 100 million vehicle miles travelled (VMT) during the decade of 2002 – 2011.
What are the odds of a car crash and their severities?
By Jorge Bush, senior researcher at National Highway Traffic Safety administration

Like most odds, calculating the odds of a car crash and their severities isn’t an exact science without having much more knowledge about your traveling statistics. The factors contributing to the variance in these odds are: where you drive, how much driving you do yearly, what kind of vehicle you drive, your personal driving experience, and your age.
Without knowing all of the details, some general odds can still be roughly concluded. The statistical projections for the odds of a crash according to age for the year 2014 are shown in Figure 1. Also the severity of crashes based on automobile accident damage costs are shown in
Figure 2 .

FIGURE 1: ODDS OF A CRASH IN 6-MONTHS
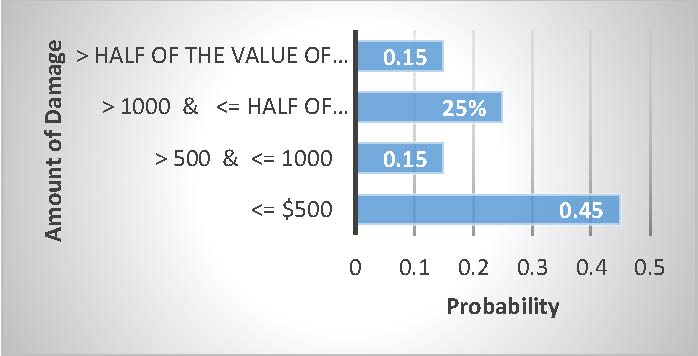
FIGURE 2: AUTOMOBILE ACCIDENT DAMAGE
Instructor’s Manual for “Liability or Collision Insurance”
In order to calculate expected cost of damage to the car: We must first find the probability distribution of damage. Document 2: “What are the odds of a car crash and their severities?” has information needed to find the probability distribution.
Assumptions:
- The odd of a crash in 6 months is 0.3. Because, this is the probability of a crash of someone in the age group 16-25.
- The amount of damage in case of accident: The average value is used. For example, if the damage is 0 ≤ ?????? ≤ 500, then damage = 250.
- Insurance premium: Document 1: “How age affect auto insurance rates”; Premiums for the age group 20 -24 is used.
Probability distribution of ?: the cost of damage (for a six months)
| ? | ?(?) | |
|---|---|---|
| 0 | 0.7 | |
| 250 | 0.135 | 0.3*0.45 |
| 750 | 0.045 | 0.3*0.15 |
| 3000 | 0.075 | 0.3*0.25 |
| 7500 | 0.045 | 0.3*0.15 |
Now let us calculate the expected cost to repair under each insurance policy and then the expected total cost.
Policy: Liability Only – If an accident occurs Jeff has to bear the repair cost:
?(?) = ∑ ? ∗ ?(?)
= 0*0.7 + 250*0.135 + 750*0.045 + 3000*0.075 + 7500*0.045
= 630
Expected Total Cost = Expected repair cost + Premium = 630 + 860
= 1490
Policy: $1000 Deductible Collision –If accident occurs Jeff has to bear the first $1000 of repair cost:
Expected Repair Cost = 0*0.7 + 250*0.135 + 750*0.045 + 1000*0.075 + 1000*0.045 = 187.50
Expected Total Cost = Expected repair cost + Premium = 187.50 + 1310 = 1497.50
Policy: $500 Deductible Collision –If accident occurs Jeff has to bear the first $500 of repair cost:
Expected Repair Cost = 0*0.7 + 250*0.135 + 500*0.045 + 500*0.075 + 500*0.045
= 116.25
Expected Total Cost = Expected repair cost + Premium
= 116.25 + 1390
= 1506.25
I recommend Liability only because it has the least expected total cost.
References
Garfield, J. 1994. Beyond Testing and Grading: Using Assessment to Improve Student Learning. Journal of Statistical Education, 2(1).
Jolliffe, F. 1991. “Assessment of the Understanding of Statistical Concepts,” in Proceedings of the Third International Conference on Teaching Statistics, Vol. 1, ed. D. Vere-Jones, Otago, NZ: Otago University Press, pp. 461-466.
Klein, S., and R. Bolus. 1982. An analysis of the relationship between clinical skills and bar examination results. Report prepared for the Committee of Bar Examiners of the State Bar of California and National Conference of Bar Examiners.
Klein, S. 1983. Relationship of bar examinations to performance tests of lawyering skills. Paper presented to American Educational Research Association, Chicago, Illinois.
Ewell, P. T. 1994. A policy guide for assessment: Making good use of the Tasks in Critical Thinking. Princeton, NJ: Educational Testing Service.
Erwin, D., and K. W. Sebrell 2003. Assessment of Critical Thinking: ETS’s Tasks in Critical Thinking. The Journal of General Education, 52(1): 50 -70.